*Click chart to enlarge.
This index measures monthly return equivalents of yield averages that are not marked to market. The Three-Month Treasury Bill Indexes consist of the last three months of Treasury bill issues.
Happy National Periodic Table Day!
Dmitri Mendeleev, John Newlands and Johann Dobereiner may not be familiar names to financial professionals and investors. Yet, they were influential on how to illustrate several key investing principles.
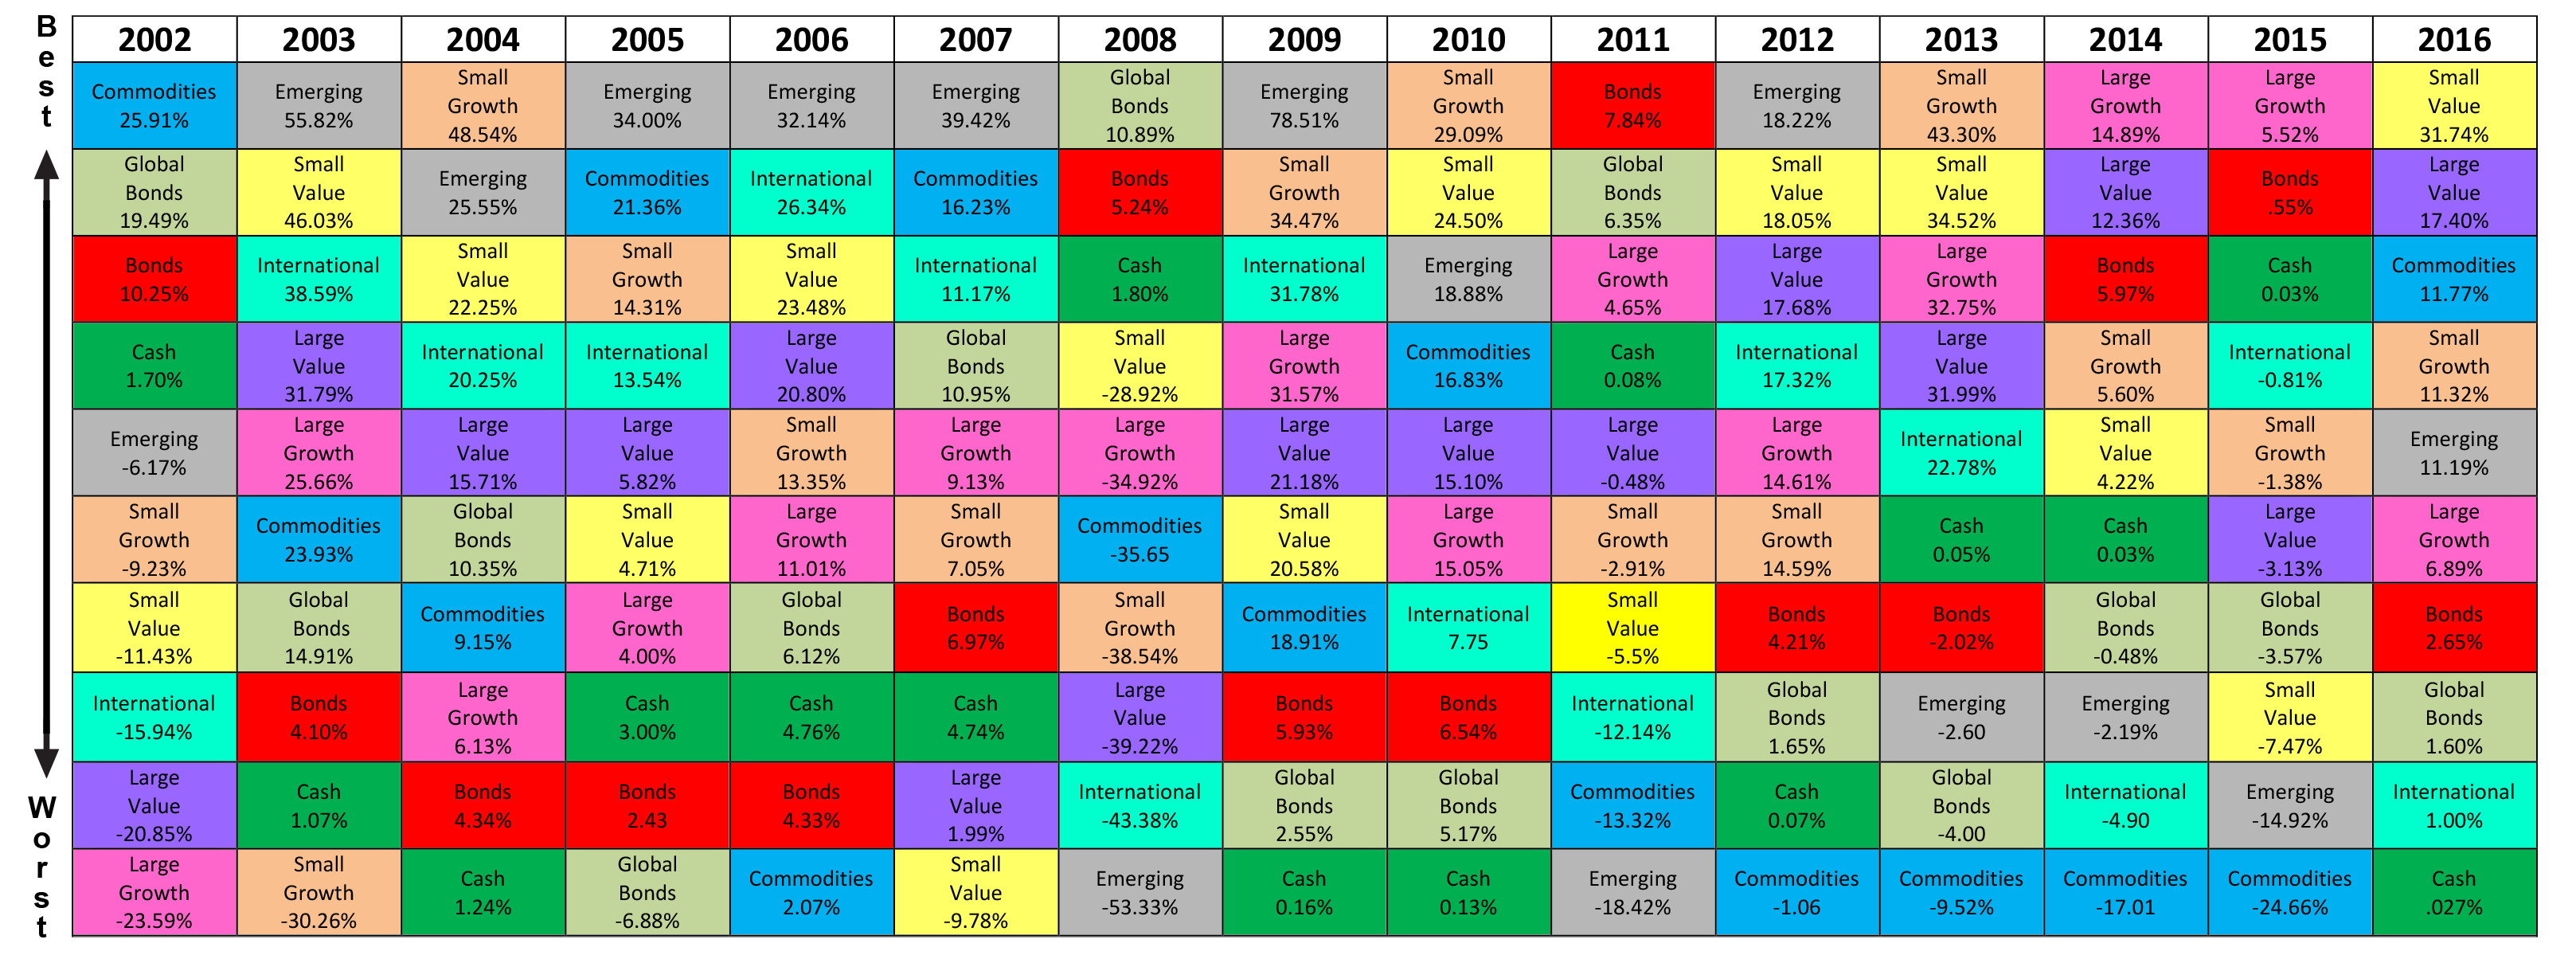
Dorbereiner, Newlands and Mendeleev were all chemists who’s work laid the foundation to our modern periodic table of elements. Sadly, when I hear periodic table I don’t think of the elements (my apologies to my high school chemistry teacher, Mr. Rohan). Instead, I picture the chart I use frequently – Periodic Table of Investment Returns – which is patterned after their collective work.
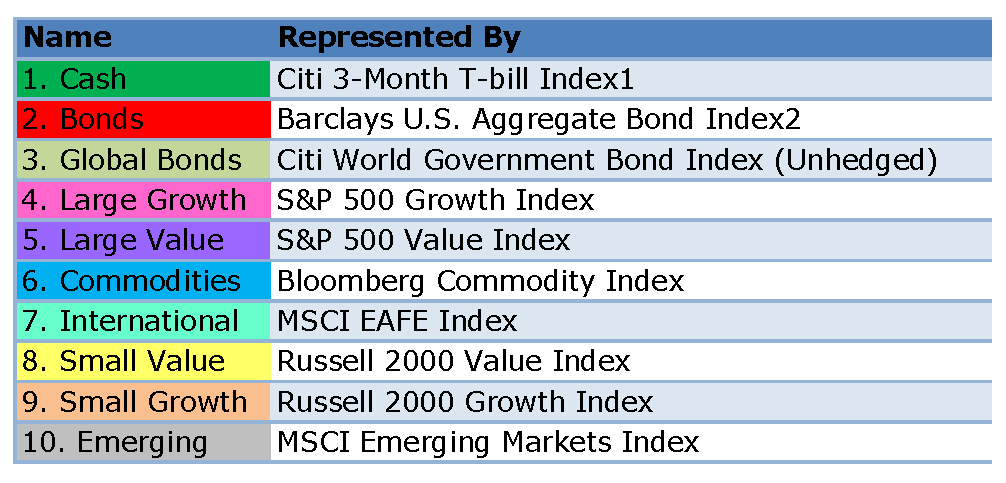
There are various iterations, but all generally show investment returns for various asset classes, ranked from best (top) to worst (bottom). Each asset class is assigned a unique color coding. Each row represents a calendar year.
The chart is intended to show the importance of diversification across asset classes (stocks versus bonds), investment styles (growth versus value), capitalizations (large versus small) and equity markets (U.S. versus international).
The rankings change every year, thereby demonstrating several key investing principles:
- Diversification: predicting which asset classes will perform best in the future is an extraordinarily difficult task.
- Rebalance: over time portfolios will drift from their targets, regular rebalancing keeps your portfolio aligned with your risk tolerance.
- Maintain Perspective & Long-term Discipline: short-term fluctuations are inevitable and returns tend to stabilize over the long-term with a diversified portfolio.
Diversification is a key investment principle many investors implement in their portfolios. Yet, diversification may make it more difficult to evaluate the performance of your investment portfolio – there are more assets classes and each will likely differ in allocation weightings. The Periodic Table of Investment Returns is an extremely useful resource for investors. It is a simple visual tool to help set your expectations regarding your investment performance. By the mere definition of diversification, your investment performance will not be as strong as the top performing asset class and will not be as poor as the bottom performing asset class. Make it a habit to review The Periodic Table of Investment Returns chart to gain a better understanding of the investment market as a whole and to help maintain realistic expectations about investment performance.
1 Citigroup 3-month T-bill Index is derived from secondary market Treasury bill rates published by the Federal Reserve Bank. 2 Barclays U.S. Aggregate Bond Index measures the U.S. bond market. 3 World Government Bond Index (WGBI) measures the performance of fixed-rate, local currency, investment grade sovereign bonds. 4 S&P 500 Growth Index measures the performance of the growth style large-cap U.S. stocks. 5 S&P 500 Value Index measures the performance of the value style large-cap U.S. stocks. 6 Bloomberg Commodity Index is composed of futures contracts on physical commodities. 7 MSCI EAFE Index measures the performance of the developed stock markets of Europe, Australia, and the Far East. 8 Russell 2000 Value Index measures the performance of the value style small-cap U.S. stocks. 9 Russell 2000 Growth Index measures the performance of the growth style small-cap U.S. stocks. 10 MSCI Emerging Markets Index measures the performance of equity markets in 23 emerging countries around the world.